The Shifting Balance of World Forces
世界均势的变动
Those fin de siècle observers of world affairs agreed that the pace of economic and political change was quickening, and thus likely to make the international order more precarious than before. Alterations had always occurred in the power balances to produce instability and often war. “What made war inevitable,” Thucydides wrote in The Peleponnesian War, “was the growth of Athenian power and the fear which this caused in Sparta. ”15 But by the final quarter of the nineteenth century, the changes affecting the Great Power system were more widespread, and usually swifter, than ever before. The global trading and communications network— telegraphs, steamships, railways, modern printing presses—meant that breakthroughs in science and technology, or new advances in manufacturing production, could be transmitted and transferred from one continent to another within a matter of years. Within five years of Gilcrist and Thomas’s 1879 invention of a way to turn cheap phosphoric ores into basic steel, there were eighty-four basic converters in operation in western and central Europe,16 and the process had also crossed the Atlantic. The result was more than a shift in the respective national shares of steel output; it also implied a significant shift in military potential.
19世纪末的那些世界事务观察家们同意这种看法:经济和政治变化的步伐正在加快,因而可能使国际秩序比以前更加不稳定。力量对比的改变总会导致动荡,而且还经常导致战争。修昔底德在《伯罗奔尼撒战争史》一书中写道:“使战争不可避免的是雅典力量的增长和这种增长在斯巴达引起的不安。”但在19世纪最后25年里,影响大国体系的变化比以往任何时候都更为广泛,而且通常更加迅速了。全球贸易和交通网络——电报、轮船、铁路、现代化的印刷厂——意味着科学技术的重大突破,或者说制造业生产新取得的进展可以在数年之内从一个大陆传播和转移到另一个大陆。在吉尔克里斯特和托马斯于1879年发明了把廉价的磷矿石转化成碱性钢的方法之后,5年的时间里,西欧和中欧出现了84座生产这种碱性钢的炼钢炉,而且这一炼钢法还跨过了大西洋。结果,不仅是各国在钢产量中所占的份额发生了变化,这还意味着军事潜力的重大变化。
Military potential is, as we have seen, not the same as military power. An economic giant could prefer, for reasons of its political culture or geographical security, to be a military pigmy, while a state without great economic resources could nonetheless so organize its society as to be a formidable military power. Exceptions to the simplistic equation “economic strength = military strength” exist in this period, as in others, and will need to be discussed below. Yet in an era of modern, industrialized warfare, the link between economics and strategy was becoming tighter. To understand the long-term shifts affecting the international power balances between the 1880s and the Second World War, it is necessary to look at the economic data. These data have been selected with a view to assessing a nation’s potential for war, and therefore do not include some well-known economic indices* which are less helpful in that respect.
我们已经看到,军事潜力和军事实力并不是一回事。出于政治文化或地理上的安全等原因,一个经济巨人可能宁愿当一个军事侏儒,而一个没有重要经济资源的国家,却可以把它的社会组织成一个令人生畏的军事强国。和在其他时期一样,“经济力量=军事力量”的等式在这个时期也有例外,下面需要讨论这个问题。但在一个现代的工业化战争的时代,经济和战略之间的联系变得更为密切了。为了弄清楚从19世纪80年代到第二次世界大战期间影响国际间力量对比的长期转变的因素,我们有必要看一看经济数字。这些数字是为了估价一个国家的战争潜力而选列的,因此不包括某些广为人知但在这一方面没有多大帮助的经济指数[2]。
Population size by itself is never a reliable indicator of power, but Table 12 does suggest how, at least demographically, Russia and the United States could be viewed as a different sort of Great Power from the others, with Germany and (later) Japan beginning to draw a little away from the remainder.
人口数量本身从来都不是一种反映实力的可靠依据,但表12的确说明俄国和美国至少在人口数字方面可以被视为与其他国家不同的另一类大国,而德国和(后来的)日本则开始稍稍超出了其他国家。
Table 12. Total Population of the Powers, 1890–193817
表12 1890~1938年各大国的总人口
(millions)
(单位:百万人)
There are, however, two ways of “controlling” the raw data of Table 12. The first is to compare the total population of a country with the part of it that is living in urban areas (Table 13), for that is usually a significant indicator of industrial/commercial modernization; the second is to correlate those findings with the per capita levels of industrialization, as measured against the “benchmark” country of Great Britain (Table 14). Both exercises are enormously instructive, and tend to reinforce each other.
但是,有两种“调控”表12中粗略数据的方法。第一种是把一个国家的总人口同生活在城市地区的人口(表13)进行比较,因为那部分人口通常很能反映工业和商业的现代化;第二种方法是把那些人口数字与人均工业化水平相互联系,在衡量这种工业化水平时以英国为“基准”国(表14)。两种做法都有很强的指导性,而且还可互相印证。
Table 13. Urban Population of the Powers (in millions) and as Percentage of the Total Population, 1890-193819
表13 1890~1938年各大国的城市人口(以百万计)及其在总人口中所占的百分比
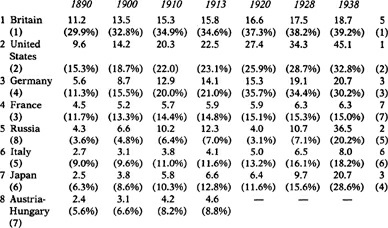
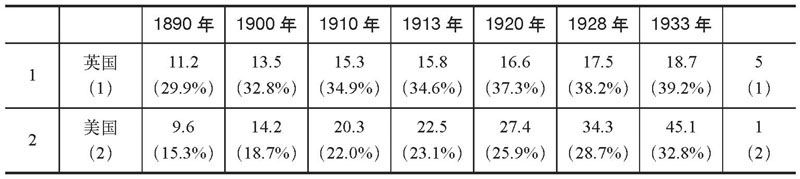
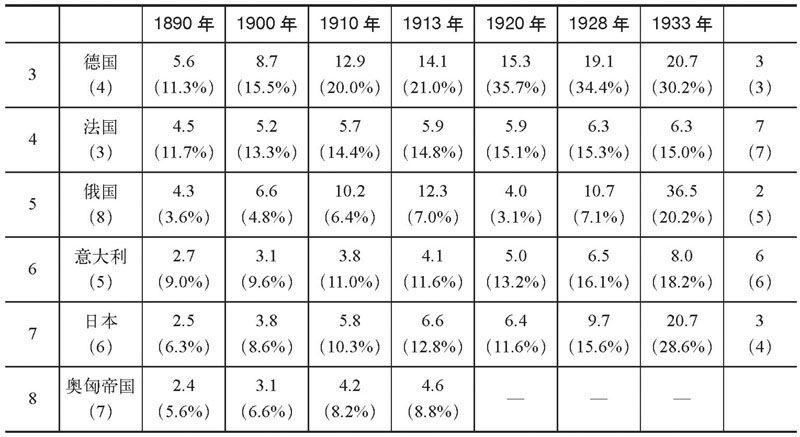
Table 14. Per Capita Levels of Industrialization, 1880–193820
表14 1880~1938年人均工业化水平
(relative to G.B. in 1900 = 100)
(以1900年的英国为100)
Without getting into too detailed an analysis of the figures in Tables 13 and 14 at this stage, several broad generalizations can be made. Once such measures of “modernization” as the size of urban population and the extent of industrialization are introduced, the positions of most of the powers are significantly altered from those in Table 12: Russia drops from first to last, at least until its 1930s industrial expansion, Britain and Germany gain in position, and the United States’ unique combination of having both a populous and a highly industrialized society stands out. Even at the beginning of this period, the gap between the strongest and the weakest of the Great Powers is large, both absolutely and relatively; by the eve of the Second World War, there still remain enormous differences. The process of modernization might involve all these countries going through the same “phases”;18 it did not mean that, in power terms, each would benefit to the same degree.
用不着对这一阶段中表13和表14中的数字进行太仔细的分析,也可以做出几个概括性的判断。一旦引入了城市人口规模和工业化程度这类衡量“现代化”的标准,大部分国家的地位同表12中的地位相比就有了很大的变动:俄国从第一位跌至最后一位,至少在20世纪30年代的工业大发展时期以前是如此;英国和德国占了应有的位置;美国在那种独一无二的众多人口和高度工业化社会的结合下脱颖而出。甚至在这一时期开始时,最强和最弱的大国之间的差距也是很大的,不管是绝对差距还是相对差距都是如此;到第二次世界大战前夕,仍然存在着很大的差距。现代化进程可能会把所有正在经历同样“阶段”的国家卷入,就实力而言,这并不意味着每一个国家收获是相同的。
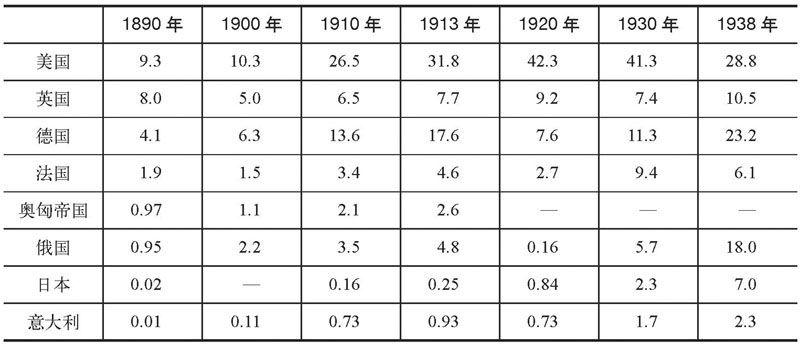
The important differences between the Great Powers emerge yet more clearly when one examines detailed data about industrial productivity. Since iron and steel output has often been taken as an indicator of potential military strength in this period, as well as of industrialization per se, the relevant figures are reproduced in Table 15.
当仔细观察有关工业生产力的数据时,大国之间的差距就显得更加清楚了。由于钢铁产量经常被看作是反映这一时期潜在军事力量和工业化本身的标志,现将有关数字重新列在表15中。
Table 15. Iron/Steel Production of the Powers, 1890-193821
表15 1890~1938年各大国的钢铁产量
(millions of tons; pig-iron production for 1890, steel thereafter)
(单位:百万吨;1890年是生铁产量,以后是钢产量)
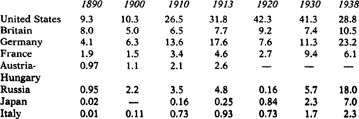
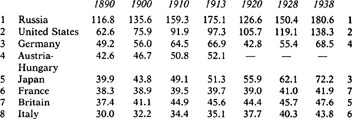
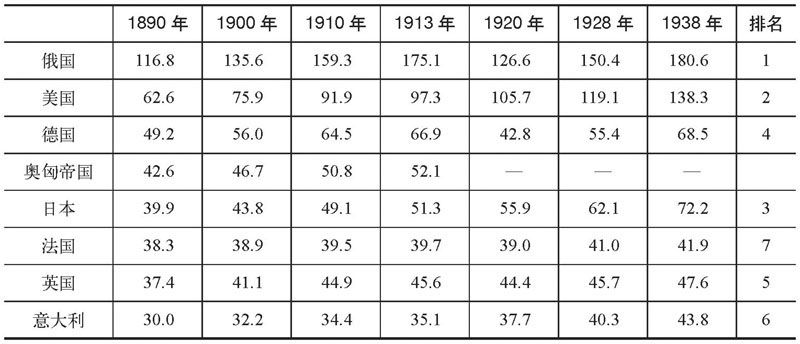
But perhaps the best measure of a nation’s industrialization is its energy consumption from modern forms (that is, coal, petroleum, natural gas, and hydroelectricity, but not wood), since it is an indication both of a country’s technical capacity to exploit inanimate forms of energy and of its economic pulse rate; these figures are given in Table 16.
但是,也许对—个国家工业化最好的衡量方法是看它对现代能源(即煤、石油、天然气和水力、电力而不是木材)的消耗,因为这既表示一个国家利用各种无生命能源的技术能力,也表示了其经济发展速度。表16列出的就是这些数字。
Tables 15 and 16 both confirm the swift industrial changes which occurred in absolute terms to some of the powers in particular periods—Germany before 1914, Russia and Japan in the 1930s—as well as indicating the slower rates of growth in Britain, France and Italy. This can also be represented in relative terms to indicate a country’s comparative industrial position over time (Table 17).
表15和表16都证实了在特定时期某些大国——1914年以前的德国、20世纪30年代的俄国和日本——在绝对数量方面所发生的工业上的迅速变化,同样可以看出英国、法国和意大利的增长速度比较低。这还可以相对地被用来表示在这整个时期一个国家相对的工业地位(表17)。
Table 16. Energy Consumption of the Powers, 1890–193822
表16 1890~1933年各大国的能源消耗
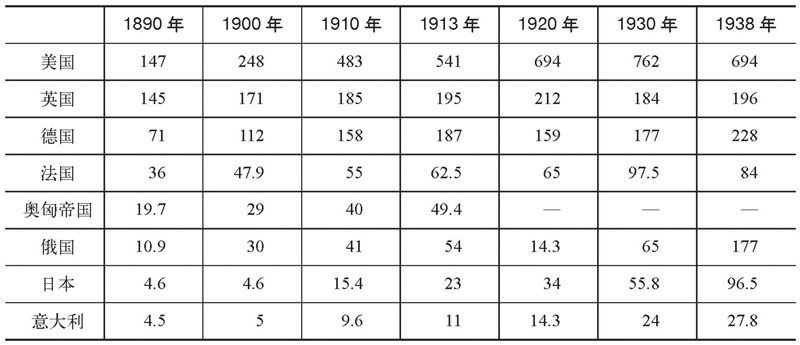
(in millions of metric tons of coal equivalent)
(相当于百万吨煤)
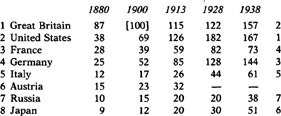
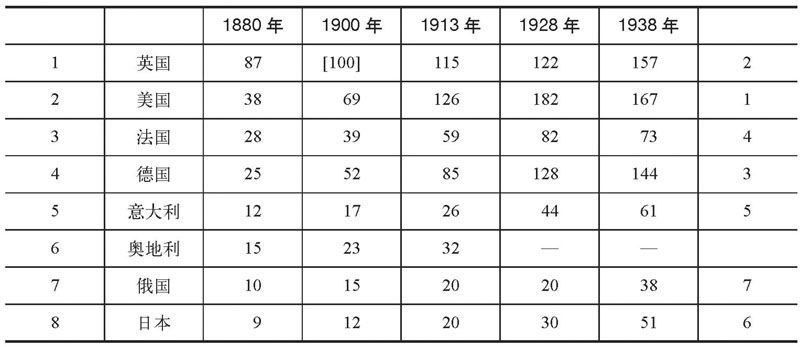
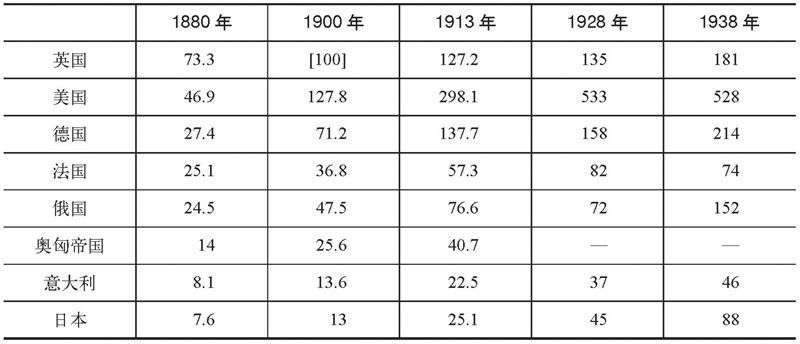
Table 17. Total Industrial Potential of the Powers in Relative Perspective, 1880–1938 23
表17 1880~1938年各大国相对的总的工业潜力
(U.K. in 1900 = 100)
(以1900年时的英国为100)
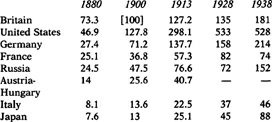
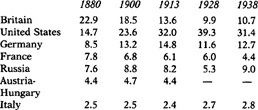
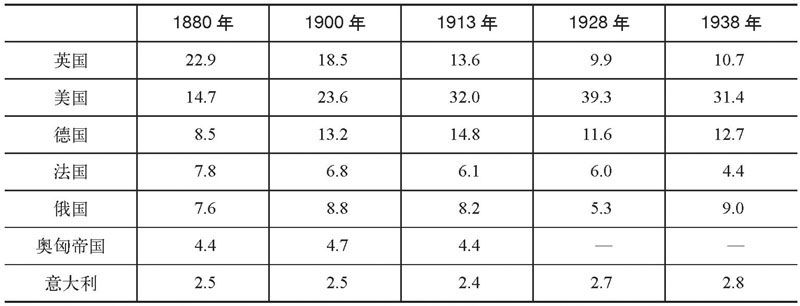
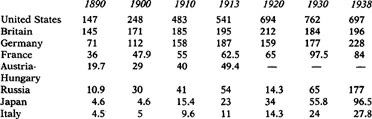
Finally, it is useful to return in Table 18 to Bairoch’s figures on shares of world manufacturing production to show the changes which occurred since the earlier analysis of the nineteenth-century balances in the preceding chapter.
最后,表18再转过来考察贝罗克关于在世界制造业生产中所占份额的数字是很有用的,这些数字将显示前一章对19世纪均势进行了较早的分析之后所发生的变化。
Table 18. Relative Shares of World Manufacturing Output, 1880-1938 (percent) 24
表18 1880~1938年各大国在世界制造业产量中所占的相对份额(%)